How Insights and Analytics Drive Creator Growth
How Insights and Analytics Drive Creator Growth
How Insights and Analytics Drive Creator Growth
Feb 10, 2026
Feb 10, 2026
Feb 10, 2026

Trying to grow an online academy without looking at your data is like driving with your eyes closed. You might get somewhere, but it's probably not where you intended to go. Real growth happens when you stop guessing what your students need and start understanding what they're actually doing.
Making the shift from simply counting sign-ups to digging into genuine insights and analytics is the most powerful move you can make. It's the secret to boosting your course completion rates, keeping students engaged, and, ultimately, driving more revenue.
From Guesswork to Growth: Why Analytics Are Your Secret Weapon

Think of analytics as the direct feedback loop that increases your income. It's like a chef tasting a sauce before it hits the plate, making tiny adjustments to perfect the final dish. Instead of drowning in spreadsheets, imagine a simple, visual dashboard that tells you a clear story about your students' journey—and how to make it better.
While many platforms like LearnWorlds or Graphy give you basic numbers, the real magic isn't just seeing the data; it's connecting it to creator outcomes. Skolasti is built to turn numbers into clear actions that directly increase completion rates and revenue. It helps you understand why students are getting stuck on a particular lesson and exactly what you can do to fix it, turning a failing course into a profitable one. To really harness this power, it helps to understand what digital analytics is and how it drives growth.
A Simple Framework for Success: Track → Interpret → Act
Let's make this feel less intimidating. You can break the whole process down into one simple but powerful framework: Track → Interpret → Act. This approach turns raw numbers into real improvements for your online academy.
Track: See what's happening inside your courses with visual dashboards. Instead of spreadsheets, look at a drop-off chart that instantly shows you the exact lesson where students lose interest and leave.
Interpret: Ask "why." Why are 70% of students abandoning the course at Lesson 5? Is the video too long? Is the concept explained poorly? The chart points you exactly where to look.
Act: Make a specific change to fix the problem. Re-record a shorter video. Add a downloadable guide to simplify the concept. Add a quick quiz to reinforce the lesson.
Before Analytics: You see a 30% completion rate and guess, "Maybe my course is too hard?" You spend weeks overhauling everything.
After Analytics: You see 70% of students drop off at Lesson 5. You spend two hours re-recording that one video. Your completion rate jumps to 65%.
This guide will walk you through each step, showing you how to turn insights and analytics from a chore into your most trusted tool for increasing revenue.
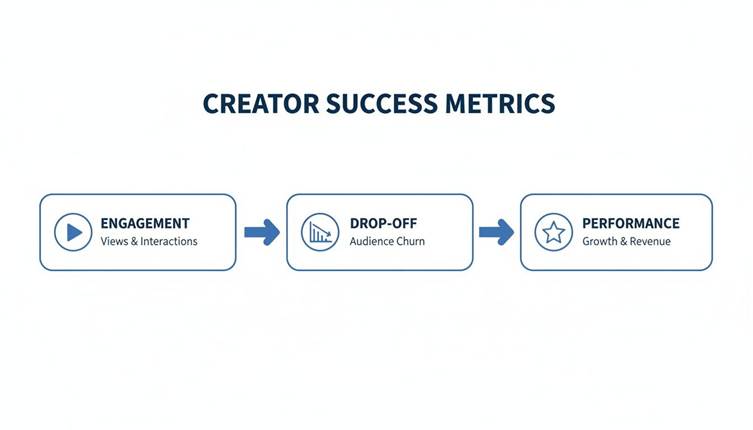
The Metrics That Truly Drive Creator Success
Let’s be honest, "data" can sound intimidating. Most course creators worry about drowning in spreadsheets and confusing charts. But the right insights and analytics aren't an ocean to drown in—they’re a lifeline to higher completion rates and more sales.
The secret is knowing that not all metrics are created equal. Some are just vanity numbers that stroke the ego but don’t help your business. Others are genuine levers for growth. The trick is to focus on data that tells you a story about your students, your content, and your revenue.
Many platforms, like LearnWorlds or Graphy, will show you a dashboard full of numbers. But a number by itself is useless. The real magic happens when you understand what that number is telling you. A metric like “Lesson Drop-off Rate” isn’t just a percentage; it's a bright red flag pointing to a specific part of your course that’s broken. It gives you a clear, actionable starting point for making things better.
Moving Beyond Vanity Metrics
To grow a real academy, you have to look past surface-level stats like total enrolments or video views. Sure, they feel good, but they don't tell you if your students are actually learning or getting the transformation they paid for. That’s where actionable analytics come in. They focus on behaviour and progress, not just clicks.
Mastering how to analyze content performance is a game-changer. It moves you from guesswork to genuine understanding.
Instead of getting lost in numbers, picture a dashboard that instantly shows you where students are thriving and where they’re giving up.
This kind of visual feedback turns abstract data into a concrete problem you can actually solve.
Metrics That Translate to Revenue and Retention
Let's cut through the noise and focus on the key performance indicators (KPIs) that directly impact your academy's health and your bank account. Think of these as your business's vital signs.
Student Engagement Hotspots: This shows you which parts of your course your students absolutely love. Are they re-watching a certain video? Is the discussion forum for one particular topic buzzing with activity? These are your content goldmines.
The Outcome (Revenue ↑): Find out what works and do more of it. This insight can guide your next course, a bonus module, or even your marketing copy, leading to happier students who buy from you again.
Lesson Drop-off Rates: This might be the single most important metric for course quality. It pinpoints the exact moment your students lose interest and walk away.
The Outcome (Completion ↑): Fixing a lesson with a high drop-off rate directly boosts your course completion rate. More successful students lead to glowing testimonials and a stronger reputation—all of which fuel future sales.
Assessment Performance: Looking at quiz scores and assignment results tells you if your teaching is actually landing. If most students fail a quiz, the problem isn't them—it's likely the lesson that came before it.
The Outcome (Revenue ↑, Refunds ↓): When you use this feedback to make your lessons clearer, your students actually master the material. This drastically increases the value of your course, cuts down on refund requests, and builds a brand known for getting real results.
Focusing on these outcome-driven metrics allows you to make precise, impactful changes. Instead of guessing and overhauling your entire course, you can surgically fix the specific areas that are holding your students—and your business—back.
Essential Metrics for Course Creator Growth
To make this even clearer, here’s a quick-reference table that breaks down the most important metrics, what they tell you, and what you should do about them. Think of it as your cheat sheet for turning data into profit.
Metric to Track | What It Reveals About Your Course | The Outcome You Can Achieve |
Lesson Drop-off Rate | Identifies the weakest or most confusing parts of your content. | Boost Completion Rate ↑ by fixing the specific lesson. |
Student Engagement | Shows which topics and formats your audience loves the most. | Increase Revenue ↑ by creating more of what works. |
Completion Rate | Measures the overall effectiveness and value of your course. | Get More Testimonials by ensuring more students succeed. |
Assessment Scores | Pinpoints where your teaching isn't clear enough for students to succeed. | Reduce Refunds ↓ by improving the clarity of your teaching. |
This table isn’t just a list; it’s a roadmap. By consistently tracking these four areas, you’ll always know exactly what to work on next to improve your students' results and grow your income. For more strategies on refining your content, check out our guide on essential tips for creating a successful online course.
Your Action Plan: The Track, Interpret, Act Framework
Knowing which metrics to track is one thing. Actually using that data to improve your courses, boost completion rates, and grow your income? That’s where the simple but incredibly powerful Track → Interpret → Act framework comes in.
Instead of getting buried in spreadsheets, this three-step cycle gives you a clear, repeatable plan for continuous improvement. It’s not about overhauling your entire course catalogue; it’s about making small, surgical changes that lead to huge results over time.
Step 1: Track Your Key Creator Outcomes
The first step is simply to watch. And no, this doesn't mean staring at raw data until your eyes glaze over. A well-designed analytics dashboard—like the one built into Skolasti—does the heavy lifting by showing you the most important trends visually. Your only job is to look for the story the numbers are trying to tell.
Platforms that only show you vanity metrics like total student sign-ups are useless for improvement. You need a dashboard that focuses on creator outcomes. What are students actually doing inside your course? Skolasti’s visual-first design immediately flags critical patterns, like where students are losing interest or which lessons they love, so you know exactly where to direct your attention.
Step 2: Interpret The Story Behind The Data
Once you’ve spotted a pattern, the next step is to ask one simple question: "Why?" This is the interpretation phase, where you put on your detective hat. The data points you to the problem; your expertise as an educator helps you understand the cause.
Let’s walk through a common scenario. Your Skolasti dashboard clearly shows something is wrong. A shocking 70% of students are dropping off after "Lesson 5: Advanced SEO Concepts." The data has done its job—it's flagged the leak. Now it's your turn to figure out why it's happening.
Here are a few likely culprits:
The content is just too complex. Is this the first really difficult topic you've introduced? Maybe you need to break it down into smaller, more manageable chunks.
The video is way too long. If all your other videos are under 15 minutes and this one is a 45-minute marathon, you’ve probably hit a wall of learner fatigue.
There’s a technical glitch. It happens. Could the video be failing to load on certain devices or browsers?
The lesson feels pointless. Perhaps students can't see how this advanced concept applies to their real-world problems.
By asking these kinds of questions, you move beyond just seeing a number. You start to understand the human experience behind the data, and that’s the key to finding the right fix.
Step 3: Act To Improve Student Outcomes
The final step is to take decisive action based on what you’ve learned. This is where you close the loop and turn your insights into real improvements that directly impact your students' success—and, by extension, your bottom line. The goal is to make one specific change, then circle back to the 'Track' phase to see if it worked.
Continuing with our "Lesson 5" problem, here’s a checklist of actions you could take:
Re-record the lesson. Break the complex topic into two shorter, more focused videos. Keep them dynamic and easy to digest.
Add a downloadable resource. Create a simple checklist, template, or cheat sheet that makes the advanced concept practical and gives students a tool they can use immediately.
Create a practical assignment. Add a short, hands-on task that forces students to apply the concept from Lesson 5, cementing their understanding.
Host a live Q&A session. Schedule a live call focused entirely on this topic to tackle student questions head-on and clear up any confusion in real-time.
By consistently applying the Track → Interpret → Act framework, you build a powerful growth engine for your academy. You’ll be making smart, data-informed decisions that lead to higher completion rates, glowing testimonials, and a much healthier business. To see how technology is making this even easier, you can learn more about the role of AI in modern online education.
How Skolasti Turns Data Into Actionable Insights

Knowing you need to track, interpret, and act on your data is one thing. Having a platform that actually makes that cycle easy and profitable is another thing entirely.
Many platforms, like LearnWorlds or Graphy, will give you an analytics dashboard. They show you what is happening—graphs, numbers, and charts. But they leave you alone to figure out the why and the what next.
Skolasti is built differently. We believe insights and analytics are only valuable if they lead to better outcomes for you: higher completion rates, happier students, and more revenue. Our platform doesn't just hand you charts; it connects the dots between data and action, turning complex information into simple, smart decisions.
From Dashboard to Direct Action
Imagine a dashboard that tells a story. You log in and immediately see a drop-off chart showing that students are consistently leaving your flagship course during Lesson 7. That’s a problem.
Instead of just showing you the problem, Skolasti helps you solve it.
The platform's intelligence might highlight that a cluster of students are asking similar questions around the 10-minute mark of the Lesson 7 video. This isn't just a data point; it's a giant, flashing sign telling you a specific concept is confusing your learners.
Before Skolasti: "My course completion rate was stuck at 40%. I knew students were dropping off, but I had no idea why or where to even begin fixing it."
After Skolasti: "The dashboard instantly showed me the exact lesson causing problems. I re-recorded a clearer explanation, and my completion rate jumped to 75% in one month."
This isn't a hypothetical. It’s the entire point of outcome-focused analytics. The data isn't the finish line; it's the starting pistol for meaningful action.
The AI-Powered Advantage
This is where Skolasti’s approach really changes the game. Once the analytics identify a common sticking point in a lesson, the platform lets you act on it instantly. You can feed this insight directly to Skolasti’s AI Teaching Assistant.
Now, when future students reach that confusing part of Lesson 7, they don't get stuck. They don't get frustrated or send you an email. The AI Teaching Assistant is already there, armed with the perfect answer, ready to help them 24/7.
You save time: Your support load drops because the most common roadblocks are handled automatically.
Students stay engaged: They get instant help the moment they need it, keeping their learning momentum high.
Completion rates rise: By removing friction, more students successfully finish your course.
This closed-loop system—where analytics reveal a problem and AI provides the solution—is what sets Skolasti apart. It’s a proactive approach that directly improves the student experience and strengthens your business. This level of personalised support is becoming essential as the Indian edtech market is estimated to hit USD 12.1 billion in 2025 and projected to reach USD 50 billion by 2035. You can read the full report about the growth of the Indian edtech market.
This process transforms analytics from a passive reporting tool into an active growth engine for your academy. You can learn more about how Skolasti’s integrated toolset supports creators by exploring our full list of platform features.
Protecting Your Data and Your Students
Using insights and analytics to make your courses better is a game-changer, but it comes with a serious responsibility. In the world of online education, trust is your most valuable asset. Your students hand over their data expecting you to keep it safe, use it ethically, and ultimately, use it to help them learn better.
This isn't just about ticking a compliance box; it's about building a professional brand that people feel good about investing in. When a student enrols, they aren’t just buying content—they're trusting you with their personal information and their ambitions. Honouring that trust is the bedrock of any successful online academy.
A smart, ethical approach to analytics means all data is anonymised and aggregated. We’re looking for trends and patterns, not snooping on individuals. The goal is to understand how students learn, not who is learning. This distinction is critical for maintaining privacy while still gathering the insights you need to improve your courses.
Safeguarding Your Intellectual Property
Beyond protecting student data, there's another asset that's just as critical: your content. As a creator, your courses, videos, and worksheets are your intellectual property. They represent years of your expertise and hard work. Letting them be easily downloaded, shared, or pirated doesn't just devalue your business—it guts your revenue.
This is why analytics and content protection have to be two sides of the same coin. It’s not enough to just grow your academy; you have to build a fortress around it from day one. Features like Digital Rights Management (DRM) and domain restrictions aren't nice-to-haves; they are essential for any serious online educator.
While many platforms offer some analytics, security can feel like an afterthought. Skolasti bakes content protection directly into the platform, so you know your hard work stays yours. This creates a secure environment where you can confidently analyse student behaviour without the constant worry of your content being stolen.
Building a secure and professional academy means creating an environment where both your students' data and your intellectual property are treated with the highest level of respect. This dual focus on privacy and protection is the foundation of a sustainable and trustworthy online business.
How Content Protection Works
A secure learning environment doesn't just happen. It's built with specific, intentional security layers that work quietly in the background to make sure your content is only seen by paying students, exactly how you intended.
Here’s how a multi-layered security approach protects your business:
Secure Delivery and DRM: This technology encrypts your video content, which is a fancy way of saying it scrambles the file to prevent unauthorised downloads and screen recording. Students can stream your lessons perfectly, but they can't easily save and share them.
Dynamic Watermarking: A subtle watermark with the student's user information can be overlaid on your videos. This is a powerful deterrent—if any content is leaked, you can trace it straight back to the source.
Domain Restrictions: This clever feature stops your course videos from being embedded and played on unauthorised websites. Your content will only work on your academy's domain, preventing others from simply stealing your embedded videos for their own sites.
Access Controls: You get to set precise rules for who can see what content and for how long. This is great for preventing account sharing and ensuring only enrolled students can view your premium materials.
These features work together to create a powerful defence for your intellectual property. They let you focus on what you do best—creating amazing content and interpreting your analytics—with the peace of mind that your business is secure. By combining powerful insights and analytics with robust protection, you aren't just building courses; you're building a fortress for your expertise.
Your Top Questions About Insights and Analytics, Answered
Jumping into insights and analytics can feel like a huge task, but it really isn't. The whole point is to demystify the numbers and show you exactly how data can be your best partner in building a successful academy.
Let’s tackle the most common questions creators have.
How Much Data Do I Really Need to Track?
This is the big one, and the answer is refreshingly simple: start small and focus on outcomes. You don’t need to drown in a hundred different metrics. To begin, you only need to watch the handful of numbers that directly tie to your students' success and your revenue.
Focus on these three to start:
Lesson Drop-off Rate: This shows you exactly where your content is losing student interest.
Assessment Scores: This tells you if your teaching methods are actually working.
Course Completion Rate: This is the ultimate measure of the value your course delivers.
Platforms like Graphy or LearnWorlds might throw dozens of data points at you, but Skolasti’s dashboard is built to put these creator-centric metrics front and centre. By focusing on these few, you sidestep the data overload and can take immediate, effective action.
Is Data Analytics Too Technical for a Non-Tech Creator?
Absolutely not. Let’s be clear: modern analytics platforms are built for creators, not data scientists. The secret is a visual-first approach. Instead of getting lost in spreadsheets, you should be looking at simple, intuitive charts that tell a story.
Think about it this way: if you see a line on a graph plummet after "Lesson 5," you instantly understand there's a problem. You don't need a statistics degree to know that’s where to focus your attention. Skolasti is designed around this very principle, turning complex data into a clear visual narrative that anyone can read and act on. It’s less about crunching numbers and more about spotting patterns in your students' journey.
What’s the First Step I Should Take with My Data?
Your very first move should always be to find and fix the biggest leak in your boat. Use your analytics to pinpoint the single biggest friction point for your students. Is there one specific lesson where an unusually high number of students just stop? That’s your starting line.
Don’t try to fix everything at once. Apply the Track → Interpret → Act framework to one problem at a time. Track the drop-off rate, figure out why that specific lesson is a roadblock, and then act by improving it.
This focused approach delivers quick wins, builds your confidence, and has an immediate positive ripple effect on your course completion rate. A single, targeted fix can often boost completion by 10-15% or more, leading to happier students and better testimonials down the line.
How Often Should I Check My Analytics?
Checking your analytics should be a regular habit, but definitely not a daily obsession. For most creators, a weekly check-in hits the sweet spot. This gives enough time for meaningful patterns to emerge, so you aren't getting distracted by tiny, daily fluctuations.
Just set aside 30 minutes every week to review your key dashboards. Look for significant changes. Did that new video you added improve the drop-off rate for Lesson 5? Are students scoring higher on the quiz after you added that extra worksheet? This steady, focused review keeps you connected to your students' experience and makes sure you're always moving forward. It turns analytics from a scary chore into a productive, empowering weekly routine that steadily grows your business.
Ready to stop guessing and start growing? Skolasti turns complex data into clear actions that boost completion rates and revenue. See how our intuitive, outcome-focused analytics can transform your online academy.
Trying to grow an online academy without looking at your data is like driving with your eyes closed. You might get somewhere, but it's probably not where you intended to go. Real growth happens when you stop guessing what your students need and start understanding what they're actually doing.
Making the shift from simply counting sign-ups to digging into genuine insights and analytics is the most powerful move you can make. It's the secret to boosting your course completion rates, keeping students engaged, and, ultimately, driving more revenue.
From Guesswork to Growth: Why Analytics Are Your Secret Weapon
Think of analytics as the direct feedback loop that increases your income. It's like a chef tasting a sauce before it hits the plate, making tiny adjustments to perfect the final dish. Instead of drowning in spreadsheets, imagine a simple, visual dashboard that tells you a clear story about your students' journey—and how to make it better.
While many platforms like LearnWorlds or Graphy give you basic numbers, the real magic isn't just seeing the data; it's connecting it to creator outcomes. Skolasti is built to turn numbers into clear actions that directly increase completion rates and revenue. It helps you understand why students are getting stuck on a particular lesson and exactly what you can do to fix it, turning a failing course into a profitable one. To really harness this power, it helps to understand what digital analytics is and how it drives growth.
A Simple Framework for Success: Track → Interpret → Act
Let's make this feel less intimidating. You can break the whole process down into one simple but powerful framework: Track → Interpret → Act. This approach turns raw numbers into real improvements for your online academy.
Track: See what's happening inside your courses with visual dashboards. Instead of spreadsheets, look at a drop-off chart that instantly shows you the exact lesson where students lose interest and leave.
Interpret: Ask "why." Why are 70% of students abandoning the course at Lesson 5? Is the video too long? Is the concept explained poorly? The chart points you exactly where to look.
Act: Make a specific change to fix the problem. Re-record a shorter video. Add a downloadable guide to simplify the concept. Add a quick quiz to reinforce the lesson.
Before Analytics: You see a 30% completion rate and guess, "Maybe my course is too hard?" You spend weeks overhauling everything.
After Analytics: You see 70% of students drop off at Lesson 5. You spend two hours re-recording that one video. Your completion rate jumps to 65%.
This guide will walk you through each step, showing you how to turn insights and analytics from a chore into your most trusted tool for increasing revenue.
The Metrics That Truly Drive Creator Success
Let’s be honest, "data" can sound intimidating. Most course creators worry about drowning in spreadsheets and confusing charts. But the right insights and analytics aren't an ocean to drown in—they’re a lifeline to higher completion rates and more sales.
The secret is knowing that not all metrics are created equal. Some are just vanity numbers that stroke the ego but don’t help your business. Others are genuine levers for growth. The trick is to focus on data that tells you a story about your students, your content, and your revenue.
Many platforms, like LearnWorlds or Graphy, will show you a dashboard full of numbers. But a number by itself is useless. The real magic happens when you understand what that number is telling you. A metric like “Lesson Drop-off Rate” isn’t just a percentage; it's a bright red flag pointing to a specific part of your course that’s broken. It gives you a clear, actionable starting point for making things better.
Moving Beyond Vanity Metrics
To grow a real academy, you have to look past surface-level stats like total enrolments or video views. Sure, they feel good, but they don't tell you if your students are actually learning or getting the transformation they paid for. That’s where actionable analytics come in. They focus on behaviour and progress, not just clicks.
Mastering how to analyze content performance is a game-changer. It moves you from guesswork to genuine understanding.
Instead of getting lost in numbers, picture a dashboard that instantly shows you where students are thriving and where they’re giving up.
This kind of visual feedback turns abstract data into a concrete problem you can actually solve.
Metrics That Translate to Revenue and Retention
Let's cut through the noise and focus on the key performance indicators (KPIs) that directly impact your academy's health and your bank account. Think of these as your business's vital signs.
Student Engagement Hotspots: This shows you which parts of your course your students absolutely love. Are they re-watching a certain video? Is the discussion forum for one particular topic buzzing with activity? These are your content goldmines.
The Outcome (Revenue ↑): Find out what works and do more of it. This insight can guide your next course, a bonus module, or even your marketing copy, leading to happier students who buy from you again.
Lesson Drop-off Rates: This might be the single most important metric for course quality. It pinpoints the exact moment your students lose interest and walk away.
The Outcome (Completion ↑): Fixing a lesson with a high drop-off rate directly boosts your course completion rate. More successful students lead to glowing testimonials and a stronger reputation—all of which fuel future sales.
Assessment Performance: Looking at quiz scores and assignment results tells you if your teaching is actually landing. If most students fail a quiz, the problem isn't them—it's likely the lesson that came before it.
The Outcome (Revenue ↑, Refunds ↓): When you use this feedback to make your lessons clearer, your students actually master the material. This drastically increases the value of your course, cuts down on refund requests, and builds a brand known for getting real results.
Focusing on these outcome-driven metrics allows you to make precise, impactful changes. Instead of guessing and overhauling your entire course, you can surgically fix the specific areas that are holding your students—and your business—back.
Essential Metrics for Course Creator Growth
To make this even clearer, here’s a quick-reference table that breaks down the most important metrics, what they tell you, and what you should do about them. Think of it as your cheat sheet for turning data into profit.
Metric to Track | What It Reveals About Your Course | The Outcome You Can Achieve |
Lesson Drop-off Rate | Identifies the weakest or most confusing parts of your content. | Boost Completion Rate ↑ by fixing the specific lesson. |
Student Engagement | Shows which topics and formats your audience loves the most. | Increase Revenue ↑ by creating more of what works. |
Completion Rate | Measures the overall effectiveness and value of your course. | Get More Testimonials by ensuring more students succeed. |
Assessment Scores | Pinpoints where your teaching isn't clear enough for students to succeed. | Reduce Refunds ↓ by improving the clarity of your teaching. |
This table isn’t just a list; it’s a roadmap. By consistently tracking these four areas, you’ll always know exactly what to work on next to improve your students' results and grow your income. For more strategies on refining your content, check out our guide on essential tips for creating a successful online course.
Your Action Plan: The Track, Interpret, Act Framework
Knowing which metrics to track is one thing. Actually using that data to improve your courses, boost completion rates, and grow your income? That’s where the simple but incredibly powerful Track → Interpret → Act framework comes in.
Instead of getting buried in spreadsheets, this three-step cycle gives you a clear, repeatable plan for continuous improvement. It’s not about overhauling your entire course catalogue; it’s about making small, surgical changes that lead to huge results over time.
Step 1: Track Your Key Creator Outcomes
The first step is simply to watch. And no, this doesn't mean staring at raw data until your eyes glaze over. A well-designed analytics dashboard—like the one built into Skolasti—does the heavy lifting by showing you the most important trends visually. Your only job is to look for the story the numbers are trying to tell.
Platforms that only show you vanity metrics like total student sign-ups are useless for improvement. You need a dashboard that focuses on creator outcomes. What are students actually doing inside your course? Skolasti’s visual-first design immediately flags critical patterns, like where students are losing interest or which lessons they love, so you know exactly where to direct your attention.
Step 2: Interpret The Story Behind The Data
Once you’ve spotted a pattern, the next step is to ask one simple question: "Why?" This is the interpretation phase, where you put on your detective hat. The data points you to the problem; your expertise as an educator helps you understand the cause.
Let’s walk through a common scenario. Your Skolasti dashboard clearly shows something is wrong. A shocking 70% of students are dropping off after "Lesson 5: Advanced SEO Concepts." The data has done its job—it's flagged the leak. Now it's your turn to figure out why it's happening.
Here are a few likely culprits:
The content is just too complex. Is this the first really difficult topic you've introduced? Maybe you need to break it down into smaller, more manageable chunks.
The video is way too long. If all your other videos are under 15 minutes and this one is a 45-minute marathon, you’ve probably hit a wall of learner fatigue.
There’s a technical glitch. It happens. Could the video be failing to load on certain devices or browsers?
The lesson feels pointless. Perhaps students can't see how this advanced concept applies to their real-world problems.
By asking these kinds of questions, you move beyond just seeing a number. You start to understand the human experience behind the data, and that’s the key to finding the right fix.
Step 3: Act To Improve Student Outcomes
The final step is to take decisive action based on what you’ve learned. This is where you close the loop and turn your insights into real improvements that directly impact your students' success—and, by extension, your bottom line. The goal is to make one specific change, then circle back to the 'Track' phase to see if it worked.
Continuing with our "Lesson 5" problem, here’s a checklist of actions you could take:
Re-record the lesson. Break the complex topic into two shorter, more focused videos. Keep them dynamic and easy to digest.
Add a downloadable resource. Create a simple checklist, template, or cheat sheet that makes the advanced concept practical and gives students a tool they can use immediately.
Create a practical assignment. Add a short, hands-on task that forces students to apply the concept from Lesson 5, cementing their understanding.
Host a live Q&A session. Schedule a live call focused entirely on this topic to tackle student questions head-on and clear up any confusion in real-time.
By consistently applying the Track → Interpret → Act framework, you build a powerful growth engine for your academy. You’ll be making smart, data-informed decisions that lead to higher completion rates, glowing testimonials, and a much healthier business. To see how technology is making this even easier, you can learn more about the role of AI in modern online education.
How Skolasti Turns Data Into Actionable Insights
Knowing you need to track, interpret, and act on your data is one thing. Having a platform that actually makes that cycle easy and profitable is another thing entirely.
Many platforms, like LearnWorlds or Graphy, will give you an analytics dashboard. They show you what is happening—graphs, numbers, and charts. But they leave you alone to figure out the why and the what next.
Skolasti is built differently. We believe insights and analytics are only valuable if they lead to better outcomes for you: higher completion rates, happier students, and more revenue. Our platform doesn't just hand you charts; it connects the dots between data and action, turning complex information into simple, smart decisions.
From Dashboard to Direct Action
Imagine a dashboard that tells a story. You log in and immediately see a drop-off chart showing that students are consistently leaving your flagship course during Lesson 7. That’s a problem.
Instead of just showing you the problem, Skolasti helps you solve it.
The platform's intelligence might highlight that a cluster of students are asking similar questions around the 10-minute mark of the Lesson 7 video. This isn't just a data point; it's a giant, flashing sign telling you a specific concept is confusing your learners.
Before Skolasti: "My course completion rate was stuck at 40%. I knew students were dropping off, but I had no idea why or where to even begin fixing it."
After Skolasti: "The dashboard instantly showed me the exact lesson causing problems. I re-recorded a clearer explanation, and my completion rate jumped to 75% in one month."
This isn't a hypothetical. It’s the entire point of outcome-focused analytics. The data isn't the finish line; it's the starting pistol for meaningful action.
The AI-Powered Advantage
This is where Skolasti’s approach really changes the game. Once the analytics identify a common sticking point in a lesson, the platform lets you act on it instantly. You can feed this insight directly to Skolasti’s AI Teaching Assistant.
Now, when future students reach that confusing part of Lesson 7, they don't get stuck. They don't get frustrated or send you an email. The AI Teaching Assistant is already there, armed with the perfect answer, ready to help them 24/7.
You save time: Your support load drops because the most common roadblocks are handled automatically.
Students stay engaged: They get instant help the moment they need it, keeping their learning momentum high.
Completion rates rise: By removing friction, more students successfully finish your course.
This closed-loop system—where analytics reveal a problem and AI provides the solution—is what sets Skolasti apart. It’s a proactive approach that directly improves the student experience and strengthens your business. This level of personalised support is becoming essential as the Indian edtech market is estimated to hit USD 12.1 billion in 2025 and projected to reach USD 50 billion by 2035. You can read the full report about the growth of the Indian edtech market.
This process transforms analytics from a passive reporting tool into an active growth engine for your academy. You can learn more about how Skolasti’s integrated toolset supports creators by exploring our full list of platform features.
Protecting Your Data and Your Students
Using insights and analytics to make your courses better is a game-changer, but it comes with a serious responsibility. In the world of online education, trust is your most valuable asset. Your students hand over their data expecting you to keep it safe, use it ethically, and ultimately, use it to help them learn better.
This isn't just about ticking a compliance box; it's about building a professional brand that people feel good about investing in. When a student enrols, they aren’t just buying content—they're trusting you with their personal information and their ambitions. Honouring that trust is the bedrock of any successful online academy.
A smart, ethical approach to analytics means all data is anonymised and aggregated. We’re looking for trends and patterns, not snooping on individuals. The goal is to understand how students learn, not who is learning. This distinction is critical for maintaining privacy while still gathering the insights you need to improve your courses.
Safeguarding Your Intellectual Property
Beyond protecting student data, there's another asset that's just as critical: your content. As a creator, your courses, videos, and worksheets are your intellectual property. They represent years of your expertise and hard work. Letting them be easily downloaded, shared, or pirated doesn't just devalue your business—it guts your revenue.
This is why analytics and content protection have to be two sides of the same coin. It’s not enough to just grow your academy; you have to build a fortress around it from day one. Features like Digital Rights Management (DRM) and domain restrictions aren't nice-to-haves; they are essential for any serious online educator.
While many platforms offer some analytics, security can feel like an afterthought. Skolasti bakes content protection directly into the platform, so you know your hard work stays yours. This creates a secure environment where you can confidently analyse student behaviour without the constant worry of your content being stolen.
Building a secure and professional academy means creating an environment where both your students' data and your intellectual property are treated with the highest level of respect. This dual focus on privacy and protection is the foundation of a sustainable and trustworthy online business.
How Content Protection Works
A secure learning environment doesn't just happen. It's built with specific, intentional security layers that work quietly in the background to make sure your content is only seen by paying students, exactly how you intended.
Here’s how a multi-layered security approach protects your business:
Secure Delivery and DRM: This technology encrypts your video content, which is a fancy way of saying it scrambles the file to prevent unauthorised downloads and screen recording. Students can stream your lessons perfectly, but they can't easily save and share them.
Dynamic Watermarking: A subtle watermark with the student's user information can be overlaid on your videos. This is a powerful deterrent—if any content is leaked, you can trace it straight back to the source.
Domain Restrictions: This clever feature stops your course videos from being embedded and played on unauthorised websites. Your content will only work on your academy's domain, preventing others from simply stealing your embedded videos for their own sites.
Access Controls: You get to set precise rules for who can see what content and for how long. This is great for preventing account sharing and ensuring only enrolled students can view your premium materials.
These features work together to create a powerful defence for your intellectual property. They let you focus on what you do best—creating amazing content and interpreting your analytics—with the peace of mind that your business is secure. By combining powerful insights and analytics with robust protection, you aren't just building courses; you're building a fortress for your expertise.
Your Top Questions About Insights and Analytics, Answered
Jumping into insights and analytics can feel like a huge task, but it really isn't. The whole point is to demystify the numbers and show you exactly how data can be your best partner in building a successful academy.
Let’s tackle the most common questions creators have.
How Much Data Do I Really Need to Track?
This is the big one, and the answer is refreshingly simple: start small and focus on outcomes. You don’t need to drown in a hundred different metrics. To begin, you only need to watch the handful of numbers that directly tie to your students' success and your revenue.
Focus on these three to start:
Lesson Drop-off Rate: This shows you exactly where your content is losing student interest.
Assessment Scores: This tells you if your teaching methods are actually working.
Course Completion Rate: This is the ultimate measure of the value your course delivers.
Platforms like Graphy or LearnWorlds might throw dozens of data points at you, but Skolasti’s dashboard is built to put these creator-centric metrics front and centre. By focusing on these few, you sidestep the data overload and can take immediate, effective action.
Is Data Analytics Too Technical for a Non-Tech Creator?
Absolutely not. Let’s be clear: modern analytics platforms are built for creators, not data scientists. The secret is a visual-first approach. Instead of getting lost in spreadsheets, you should be looking at simple, intuitive charts that tell a story.
Think about it this way: if you see a line on a graph plummet after "Lesson 5," you instantly understand there's a problem. You don't need a statistics degree to know that’s where to focus your attention. Skolasti is designed around this very principle, turning complex data into a clear visual narrative that anyone can read and act on. It’s less about crunching numbers and more about spotting patterns in your students' journey.
What’s the First Step I Should Take with My Data?
Your very first move should always be to find and fix the biggest leak in your boat. Use your analytics to pinpoint the single biggest friction point for your students. Is there one specific lesson where an unusually high number of students just stop? That’s your starting line.
Don’t try to fix everything at once. Apply the Track → Interpret → Act framework to one problem at a time. Track the drop-off rate, figure out why that specific lesson is a roadblock, and then act by improving it.
This focused approach delivers quick wins, builds your confidence, and has an immediate positive ripple effect on your course completion rate. A single, targeted fix can often boost completion by 10-15% or more, leading to happier students and better testimonials down the line.
How Often Should I Check My Analytics?
Checking your analytics should be a regular habit, but definitely not a daily obsession. For most creators, a weekly check-in hits the sweet spot. This gives enough time for meaningful patterns to emerge, so you aren't getting distracted by tiny, daily fluctuations.
Just set aside 30 minutes every week to review your key dashboards. Look for significant changes. Did that new video you added improve the drop-off rate for Lesson 5? Are students scoring higher on the quiz after you added that extra worksheet? This steady, focused review keeps you connected to your students' experience and makes sure you're always moving forward. It turns analytics from a scary chore into a productive, empowering weekly routine that steadily grows your business.
Ready to stop guessing and start growing? Skolasti turns complex data into clear actions that boost completion rates and revenue. See how our intuitive, outcome-focused analytics can transform your online academy.